
webODV — Online extraction, analysis and visualization of environmental data
ODV (Ocean Data View) is a widely used software package for the analysis, exploration and visualization of oceanographic and other environmental data with more than 10,000 active users. It has been developed at Alfred Wegener Institute for Polar and Marine Research (AWI).
ODV is by design a stand-alone software, which can be installed on Windows, Mac and Linux operating systems. To simplify the access to ODV and to strengthen collaborations, reproducibility and sharing, we have developed an online version of the ODV software called webODV. Up to now, we are operating several static webODV instances (1, 2, 3, 4), which provide large datasets for fast and easy data extractions, visualizations and analyses online.
In the framework of HIFIS, we already introduced the software amongst the “Helmholtz Software Spotlights” series. Now, we are planning to provide private webODV instances as Helmholtz Cloud service, which can be easily accessed online: Users can login via the Helmholtz AAI and will have a workspace to upload private data.
Concept
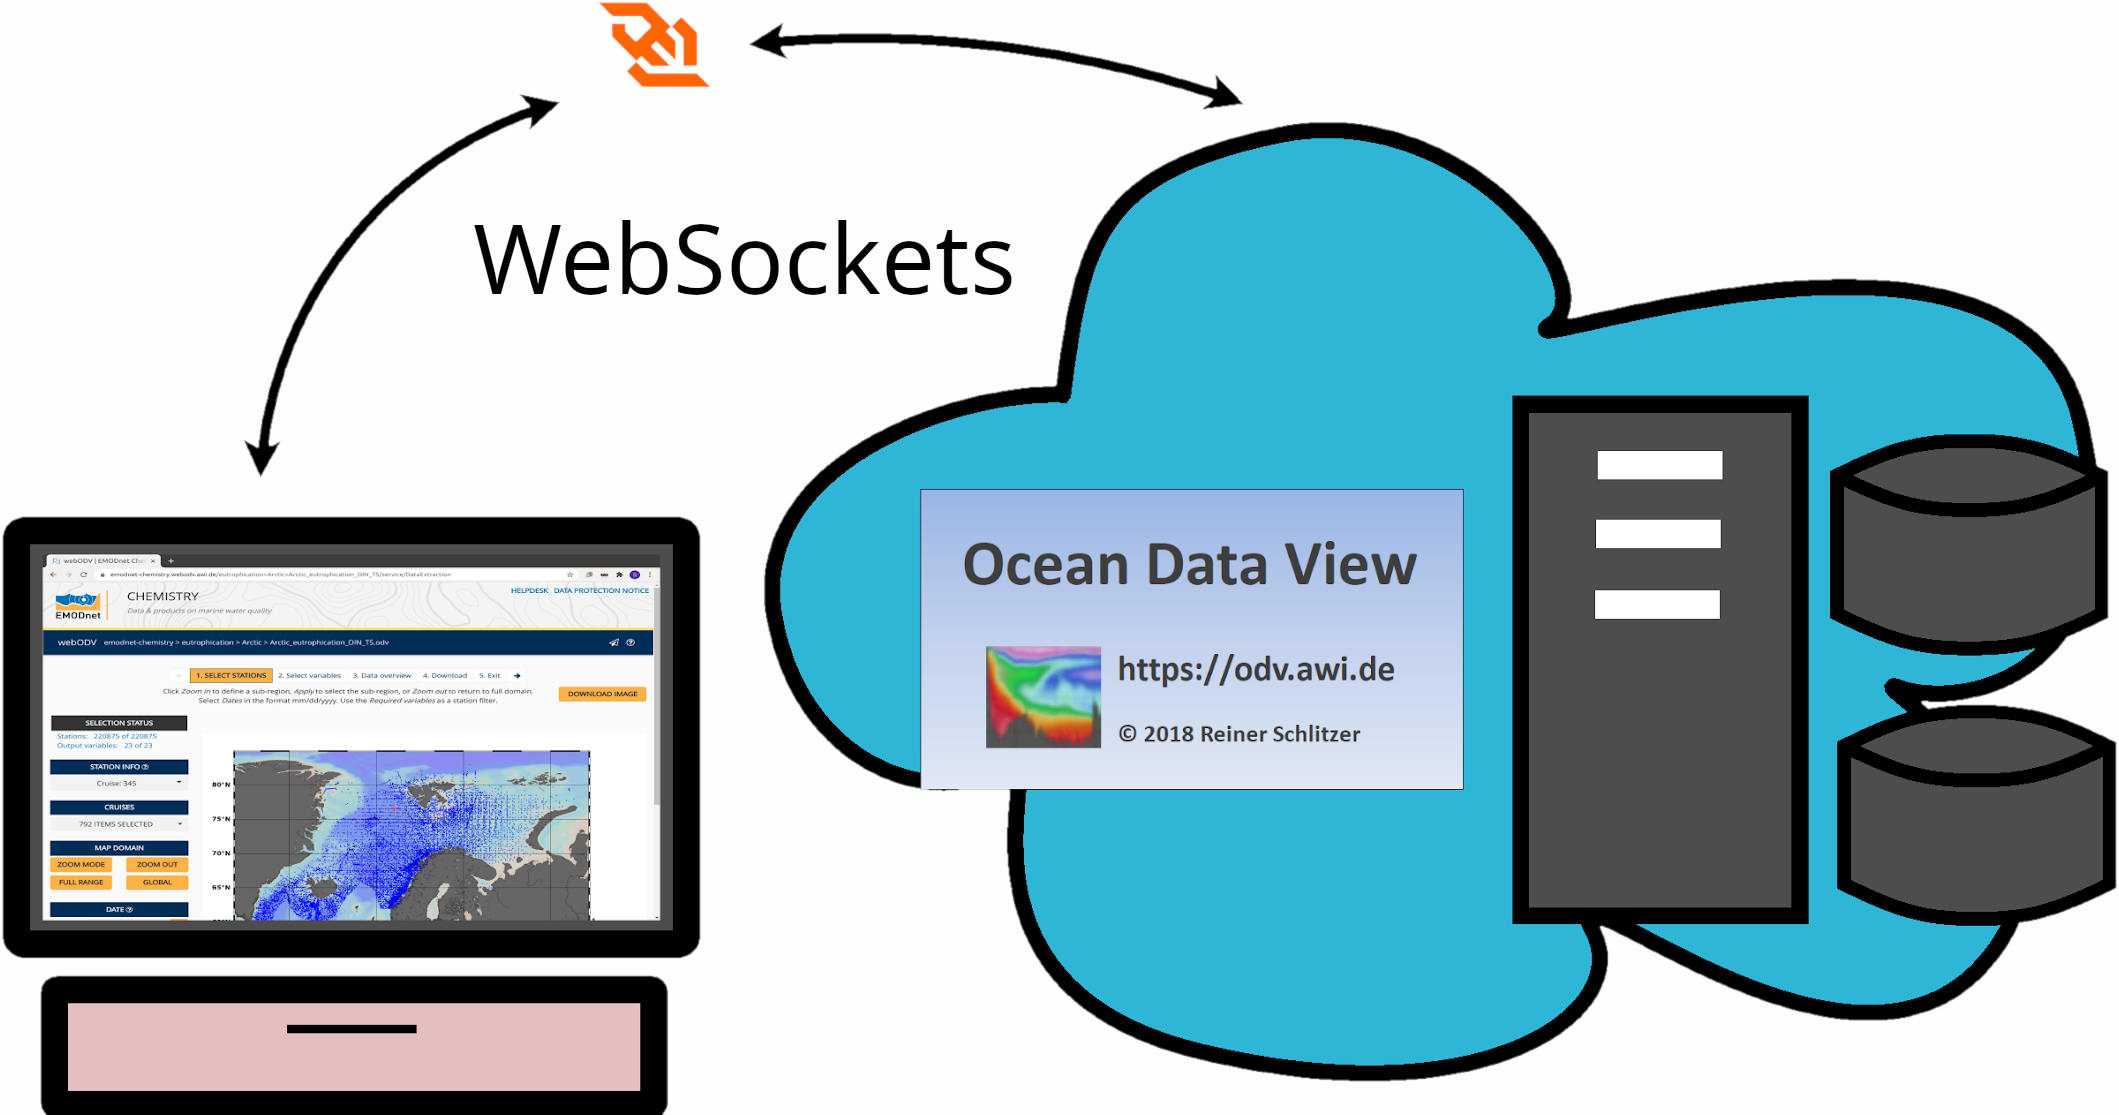
The webODV application consists of a browser client (mainly based on HTML, CSS and JavaScript) and a server, holding the datasets and running a special version of the ODV software. The key to make webODV truly interactive and as fast and agile as desktop software is the usage of the WebSocket technology for communication between client and server.
WebSockets are permanent, bi-directional connections between client and server for transmission of arbitrary text or binary messages with very small latency.
Services
Presently, webODV provides two complementary services. Users select between these services after choosing a dataset.
-
Data Extractor: The Data Extraction service provides data sub-setting as easy and fast as possible. A pager on the top of the site guides the user through the pages, which includes mainly the selection of stations, variables and finally the download of the data as text files, ODV collections or netCDF files.
-
Data Explorer: The Data Exploration service or ODV-online aims to provide the look-and-feel and functionality of the desktop ODV in the browser window for creating maps, surface plots, section plots, scatter plots, filtering data etc. As in the desktop ODV, left mouse clicks on stations or data points select these items. Right-clicks bring up context menus providing the familiar ODV functionality.
Reproducibility
FAIR data is one of the key concepts of modern and future oriented data science. Analyses and visualizations which have been created with ODV-online can be saved or exported and provide full reproducibility.
Examples
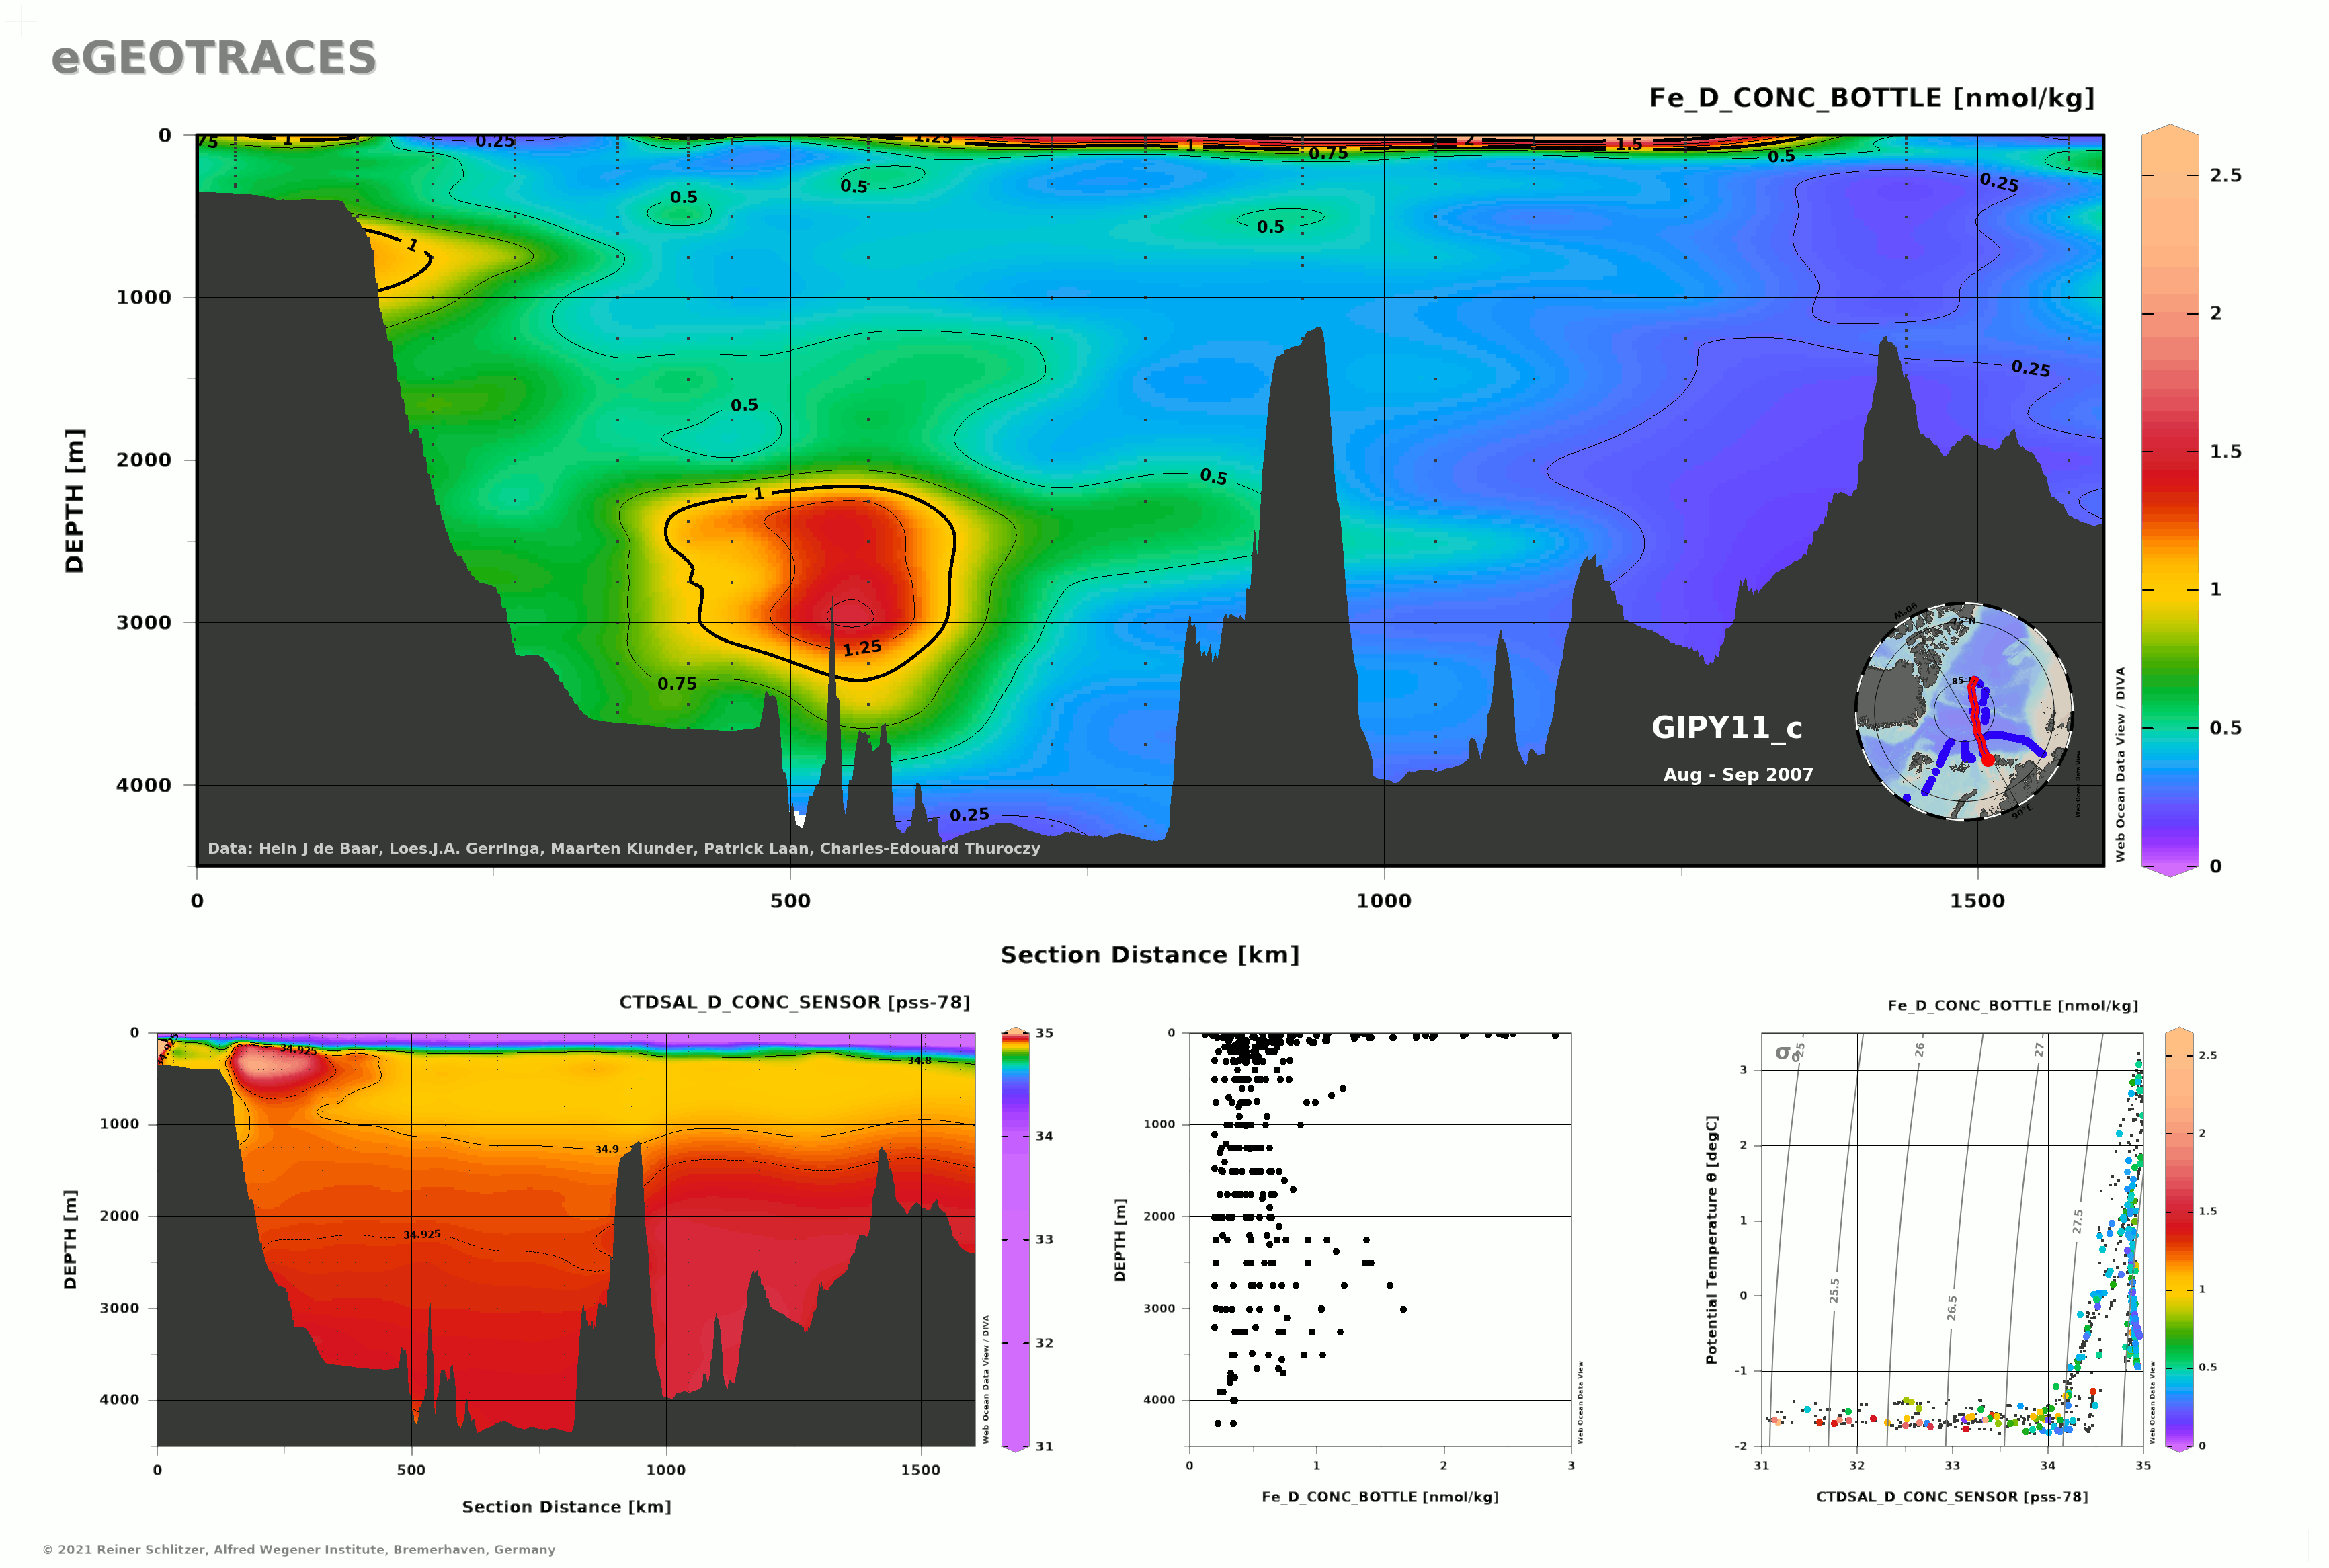 Figure 1: A section plot through the Arctic ocean showing the iron concentration. A highly active hydrothermal vent (e.g. Black Smoker, White Smoker) is visible over an undersea mountain ridge.
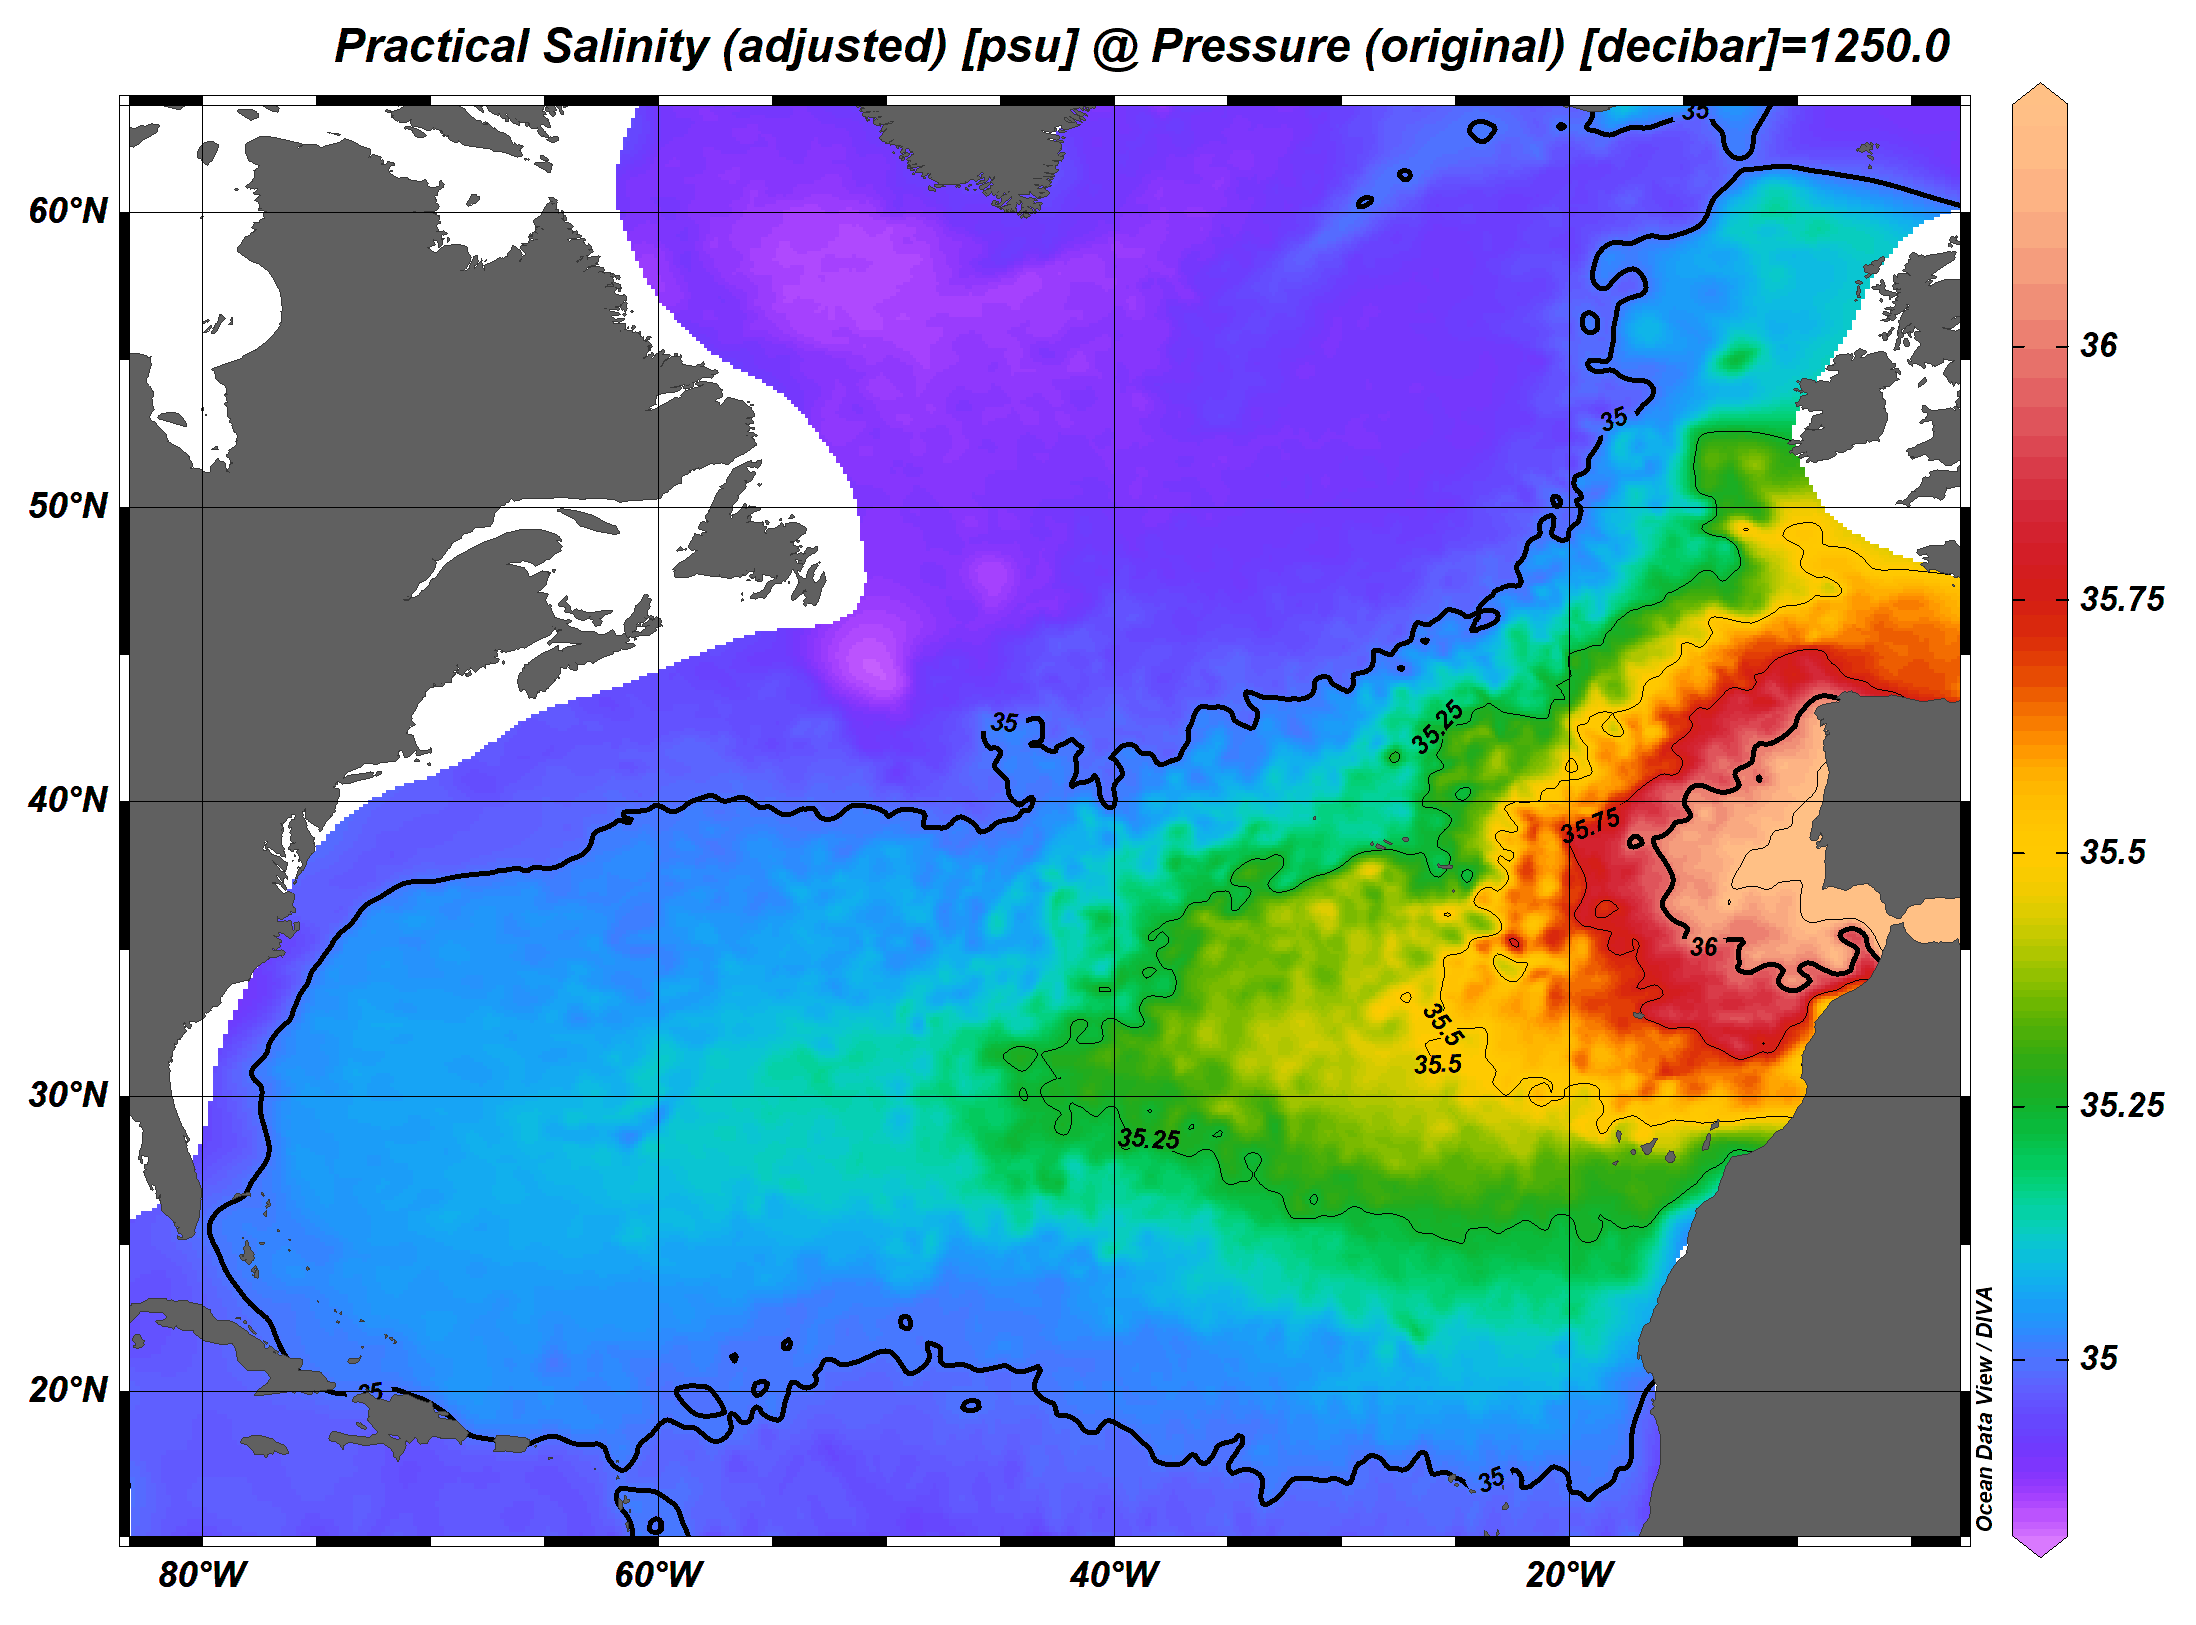 Figure 2: Salinity in about 1250 m depth in the North Atlantic clearly showing the high-salinity plume of the Mediterranean outflow.
Get in contact
For webODV: Sebastian Mieruch-Schnülle, AWI
For HIFIS: HIFIS Support