Fundamentals
Plotting Share Prices
Your friend has written a simulation to predict the share prices of a company. Now, they would like your help to visualize the data.
Here is the simulation they have so far:
stock_prediction.py
from random import random
from datetime import datetime, timedelta

# Initial parameters
value_count = 365                 # How many days to predict
start_day = datetime(2020, 1, 1)  # Start day of the prediction
price = 50 * (1 + random())       # Initial share price

# Prediction data
share_prices = [
    price := price - 0.05 + random() / 10
    for _ in range(value_count)
]

# Dates assiciated with the data
days = [
    start_day + timedelta(days=current_value)
    for current_value in range(value_count)
]
- Copy the code into a new script
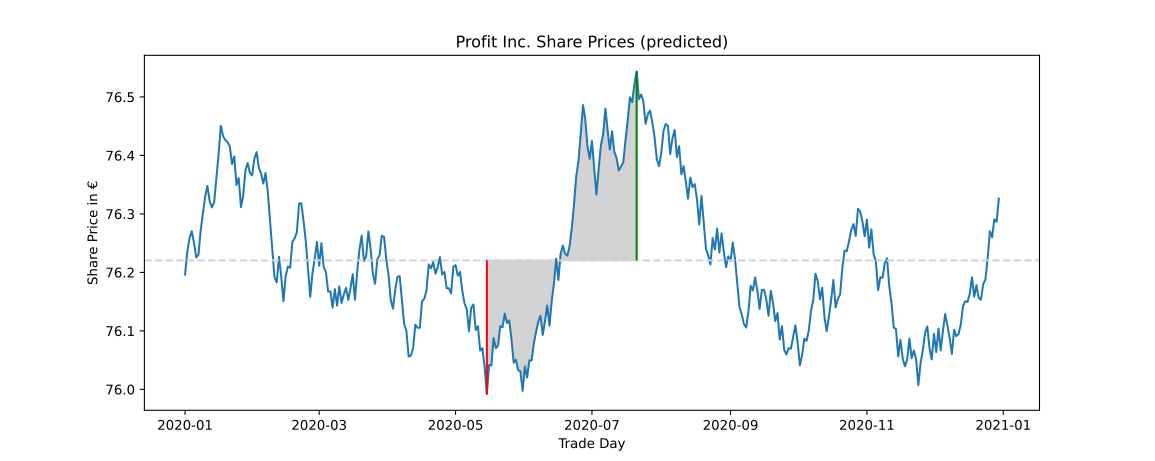
price_prediction.py. - Do a simple plot of the
share_pricesover thedays. - Add labels and a title to your plot
- Label the x-axis as Trade day
- Label the y-axis as Share Price in €
- Title the plot as Profit Inc. Share Prices (predicted)
- Find average value for the
share_prices.- Draw a dashed, light gray
axhline(…)at the average share price
- Draw a dashed, light gray
- Find the minimum and maximum share prices and the days on which they occur
- Draw a solid red
vlines(…)at the minimum share price day from the average value to the minimum share price - Draw a solid green
vlines(…)at the maximum share price day from the average value to the maximum share price - Fill in the area between the share price curve and the average line, between the minimum and maximum share price day. Consider that the minimum may occur either before or after the maximum. Use light gray as the fill color as well.
- Draw a solid red
Example Output

Coffee consumption
Oliver is responsible for our office coffee machine. He set up a list where everyone makes a mark when they drink a coffee so he can do the accounting later. Since he is pretty busy, he asked you to help with the accounting for this month.
Here is the data provided to you as a python dictionary:
- Create a new script
coffe_consumption.pyand copy the data into it. - Turn the dictionary into a pandas-Series.
Note, that when providing a dictionary as the
data, the keys will automatically become the index.- Assign the Series with the name Coffee 2024-02
- Find out who is drinking the most coffee and how much.
Use the
.max()- and.idxmax()-methods of theSeriesdata type for this purpose. - Oliver paid
24,98€in this month to buy coffee beans. Calculate the minimal price per cup that is required to break even. - To offset the cost and collect money for a new coffee machine, the current price is set to 0,35€ per cup.
From your existing series, generate a new one containing the outstanding debt (i.e. how much money they need to pay) of each person.
Remember that you can apply mathematical operation on the whole series at once.
- Give this new series the name Debt 2024-02
- The balance from the earlier month is given in the second tab above.
Copy the data into your code as well.
- Turn the balance (i.e. how much money they currently have on their account) into a series as well.
- Subtract the debt from the balance.
Note how some entries will result in
NaN-values. This happens when the previous balance or the debt for a given person is not known and thus no meaningful calculation can be made. - Add an initial balance of 0,00€ for the missing person on the balance sheet before calculating the final balance.